Monitoring AI Agents: Reliability, Latency, Security and Cost
AI agents do not fail like ordinary web services. A request can return HTTP 200 while the answer is wrong, the tool call was silently retried three times, and the bill for that single conversation is twenty times the median. Monitoring them well means watching four things at once: whether the work completed correctly, how long each stage took, what the agent was allowed to touch, and what it cost. Each has a business consequence and a tradeoff worth making deliberately.
Why agents need their own monitoring
A conventional service has a few failure modes: it is up, it is fast, it returns the right status code. An agent adds a planning loop, one or more model calls, retrieval, and external tools. Any of those can succeed individually while the overall task fails. A retry that masks a flaky tool also doubles token spend. A model that answers in two seconds may still be useless because it chose the wrong function.
Uptime dashboards therefore tell you almost nothing about agent health. You need traces that follow a single user request across every model call and tool invocation. OpenTelemetry’s GenAI semantic conventions define span and metric names for model calls, token usage, and agent operations. Adopting a common schema early keeps you from rewriting dashboards when you change providers.
Reliability: measure task completion, not just availability
The first reliability metric is task success rate: did the agent produce an acceptable outcome for the user’s actual goal? For an internal automation, that might mean a valid structured output that passed validation. Log the outcome on the root span. Without it, you are optimizing the wrong thing.
Second, treat every external dependency as unreliable. Tool calls time out, APIs return rate-limit errors, and retrieval returns nothing useful. Instrument retries as their own spans with an attempt counter, and record whether each retry came from a timeout, a rate limit, or a malformed response. The distinction matters because retries multiply latency and cost, and they can repeat side effects.
That leads to idempotency. If a tool sends an email or creates a record, a retry can duplicate it. Use idempotency keys or a deduplication layer, and monitor how often the same logical operation is attempted more than once. A rising retry rate is an early warning that a dependency is degrading.
Finally, bound the loop. Agents that plan iteratively can run away, consuming tokens and tool calls without converging. Set hard limits on steps, wall-clock time, and spend per request, and emit a metric when a limit is hit. A sustained increase means your prompts, tools, or model choice need attention.
Latency: separate queue time from thinking time
A single end-to-end latency number is not actionable. Split it into four parts: time waiting in your queue, time in the model, time in tools and retrieval, and time streaming the response back. Each has a different fix. Queue time points to capacity or concurrency limits. Model time points to prompt size, output length, or model choice. Tool time points to an external dependency. Streaming time points to your own network path.
Record these as separate spans and as histogram metrics. Prometheus histograms let you compute percentiles across all replicas and change the window or percentile later without re-instrumenting, which summaries cannot do.
Watch the tail, not the average. Averages hide the requests that hurt: the ones that hit a retry, waited behind a long job, or generated a very long response. Track p95 and p99 for each stage. Also measure time to first token for interactive agents, because users judge responsiveness from the first visible output.
Latency and quality trade against each other. Larger models and longer reasoning often improve results at the cost of seconds. Run a small evaluation set and compare success rate against latency and cost for each configuration, then route by task: cheap and fast for simple classification, slower and stronger for work that must be right.
Security: what the agent can do and what you record
Agent security starts with permissions. Give each tool the narrowest scope that works, and run tools under a distinct identity rather than a shared admin credential. If an agent can read a database, it should not also be able to drop tables. If it can call an internal API, restrict which endpoints and methods. This is the control that limits blast radius when a prompt is manipulated.
Prompt injection is the central risk: untrusted text, whether a user message, a retrieved document, or a tool response, can contain instructions that redirect the agent. OWASP’s Top 10 for LLM Applications lists prompt injection and excessive agency as distinct risks, and the mitigation for the latter is architectural, not textual. Treat model output as untrusted input. Validate structured output before acting on it, and require confirmation for destructive or high-value operations.
Monitoring supports this by making agent actions auditable. Log which tool was called, with what arguments, under which identity, and what it returned, but redact secrets and personal data before they reach your telemetry backend. Decide retention deliberately: keep structured metadata longer, keep raw content briefly or not at all, and restrict access.
Also monitor for anomalies, not only failures. A sudden jump in tool calls per request, repeated access to the same resource, or attempts to reach unusual destinations can indicate misuse or a compromised prompt. These signals are cheap to collect and hard to reconstruct later.
Cost: attribute spend before you optimize
Token-based pricing makes cost a per-request property, which means it can be attributed. Record input tokens, output tokens, and the model used on every model span, then compute cost per trace and roll it up by feature, customer, or endpoint. Without attribution, cost reduction becomes guesswork, and the loudest complaint wins instead of the largest line item.
Once you can see where spend goes, the levers are concrete. Shorten prompts and retrieved context; long contexts are billed and also add latency. Cap output length where the task allows. Cache results that are safe to reuse, and deduplicate identical requests. Route routine work to smaller models and reserve larger ones for cases that need them. Add per-tenant and per-request budget guards so a runaway loop cannot produce a surprise invoice.
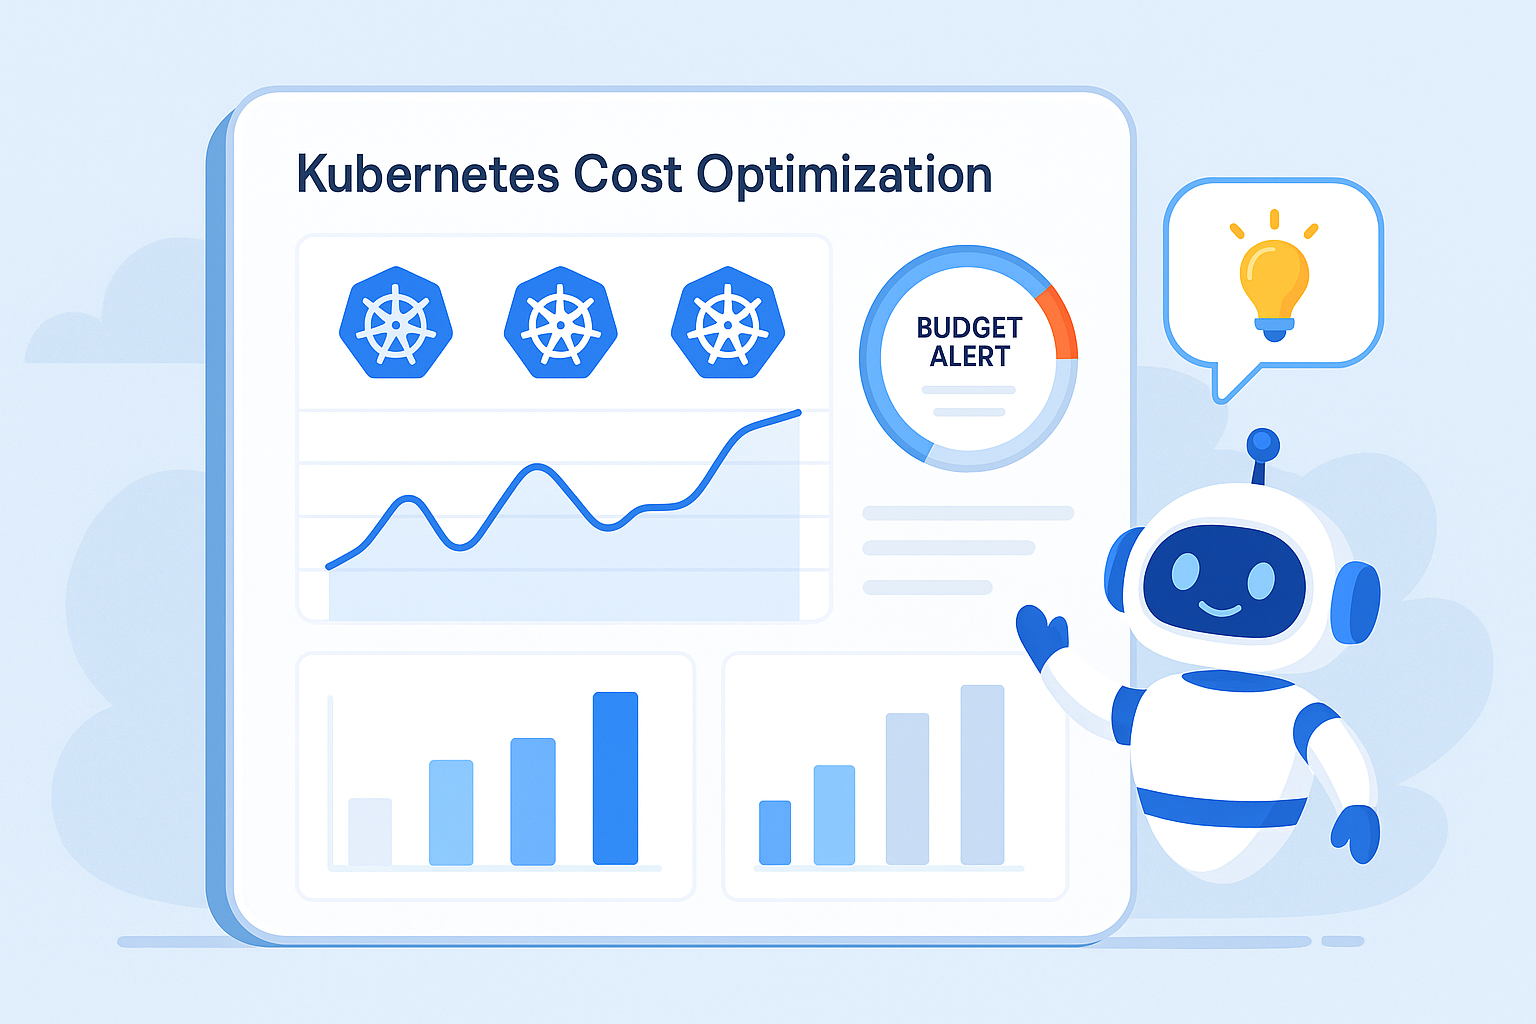
Cost and reliability pull against each other. Aggressive retries improve success rates and raise spend. A cheaper model may increase human escalation, which has its own cost. Track the full unit economics: cost per resolved task, including retries and human time, is the number a business owner can act on. Kubernetes resource requests and limits also affect the bill, so right-size CPU and memory for your agent workers and avoid over-provisioning idle capacity.
What to instrument first
Start with distributed tracing across the request, one span per model call and per tool call, with token counts and model identity as attributes. Add outcome logging on the root span. Then add four histograms: end-to-end latency, model latency, tool latency, and tokens per request. Add counters for retries, limit breaches, and validation failures. Only after those exist should you invest in dashboards and alerts.
Keep cardinality under control. Do not put user IDs, raw prompts, or request IDs in metric labels; use traces for high-cardinality detail and metrics for aggregates. Sample traces intelligently, keeping all errors and a representative slice of successes.
Frequently Asked Questions
Do we need a separate observability stack for agents? Usually not. Extend your existing tracing and metrics pipeline with agent-specific spans and attributes. A separate stack adds cost and splits the investigation path exactly when you need it unified.
What is the single most useful metric? Cost per successful task. It combines reliability, retry-driven latency, and token spend into one number that maps to business value.
How do we monitor quality without reviewing every response? Use a small, stable evaluation set with automated checks, plus sampled human review. Track pass rates over time and alert on regressions.
Where should budget limits live? In the application and at the gateway. Enforce per-request and per-tenant limits close to the model call, and alert when they trigger so limits do not silently degrade the product.
How long should we keep prompts and outputs? As short as your compliance and debugging needs allow. Keep metadata longer, redact sensitive fields, and restrict access to raw content.
If you are building agents on Kubernetes and want monitoring that reflects reliability, latency, security, and cost together, talk to Kubeify about designing the instrumentation and guardrails around your workloads.